First launch of Activity on Web UI freezes it.
-
[x] I am on the latest ActivityWatch version.
-
[x] I have searched the issues of this repo and believe that this is not a duplicate.
-
Win 10 - 21H1:
-
v0.11.0:
Describe the bug
Every day, when I open the web UI and click "Activity" for the first time, it freezes for a minute. Reloading the page doesn't help. After a minute (I click Activity again), it starts working normally for the whole day.
I don't leave my PC open at night, so I am not sure if that would create a difference or not.
To Reproduce
Right Click AW -> Open Dashboard Click Activity
Expected behavior
Open instantly, like second+ time.
Documentation
I am not sure if it is about my problem, but it was the weird one among other logs aw-watcher-window_2021-06-27T15-06-42.log
Additional context
Tried to search with few different keywords but couldn't see anything about the issue. Hopefully its not duplicate.
Hi there! As you're new to this repo, please make sure you've used an appropriate issue template and searched for duplicates (it helps us focus on actual development!). We'd also like to suggest that you read our contribution guidelines and our code of conduct. Thanks a bunch for opening your first issue! 🙏
Have seen similar problems regularly. Main cause for the issue is that when the size of database has grown over time, speed of the application slows down similarly. Most likely there should be some kind of database optimizations to cut down the processing time.
Have seen similar problems regularly. Main cause for the issue is that when the size of database has grown over time, speed of the application slows down similarly. Most likely there should be some kind of database optimizations to cut down the processing time.
I am not sure if that's the issue because as far as I can remember I was using this program for few days when I create this post. Database shouldn't be that big?
Hmm, probably different cause then. Haven't seen speed issues on a Linux virtual machine, but Windows has speed issues with the same software.
Hmm, probably different cause then. Haven't seen speed issues on a Linux virtual machine, but Windows has speed issues with the same software.
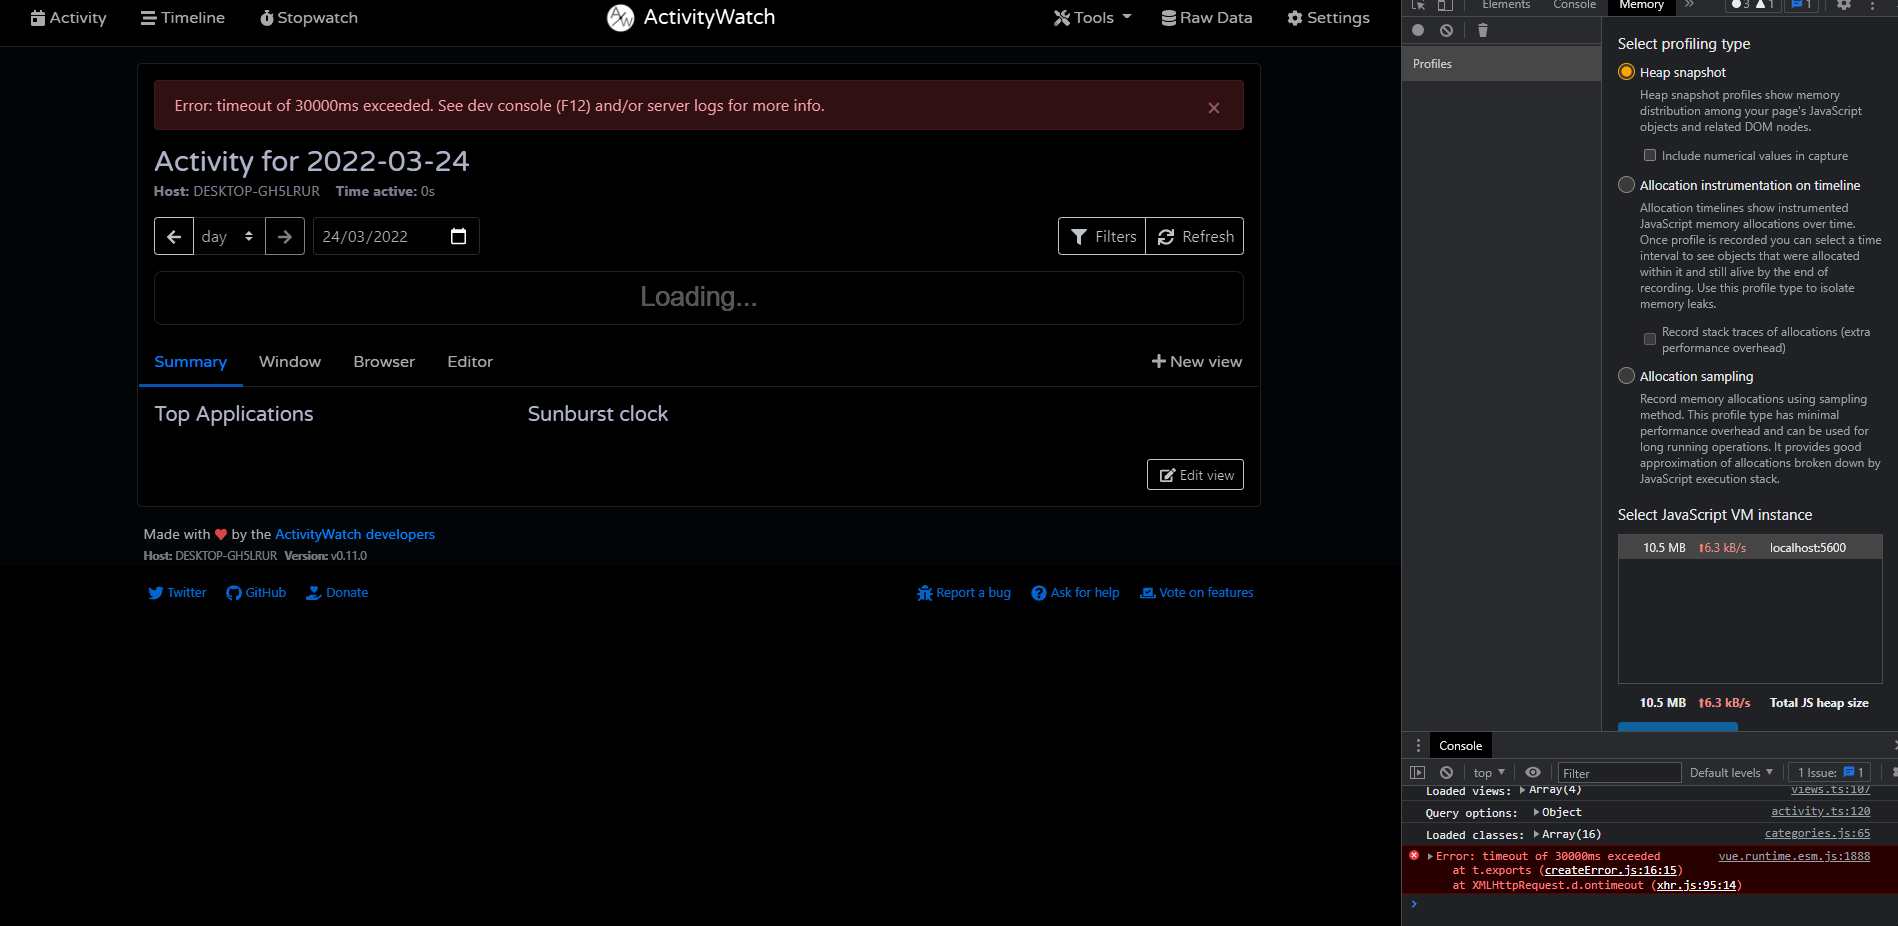
I just checked again and I don't even need to click something. As soon as Dashboard opens, I can't even refresh the page. It freezes for a minute and then starts working normally without any speed issue.
What you said makes sense as well since this kinda looks like a "loading database" issue, but as I said before I remember it was several days old when I create this post, so I am not sure :/
Have the same problem. Been using it for about a month and a half and every time I open the dashboard for the first time I have to wait about half a minute before I can access any page, but after that everything works normally.
@MartinNiederl Can you confirm that you are also using Windows?
Seems to be Windows-specific, weirdly enough.
Fetching data should not freeze the dashboard. It might take a while to load, but the UI should remain responsive. It must be some other weird issue.
Can people test with different browsers and see if the behavior is the same?
Can people test with different browsers and see if the behavior is the same?
I just test with Edge - Brave - Opera GX and Firefox. All have the issue (Edge was the worst for some reason.)
But I open them all at once, so I am not sure if it would be different when I open them one after the other. I can try it tomorrow.
Just tried it again. After opening it on one of the browsers, others no longer have the problem.
@ErikBjare Yes I am using Windows, more specifically Windows 11 21H2 22000.556
I only tested it with Chrome and Edge and get pretty much the same behavior for both.
I have the same issue. I am experiencing it for 9+ months. Current system:
Windows 11 21H2 Build 22000.675
Firefox 100.0.2
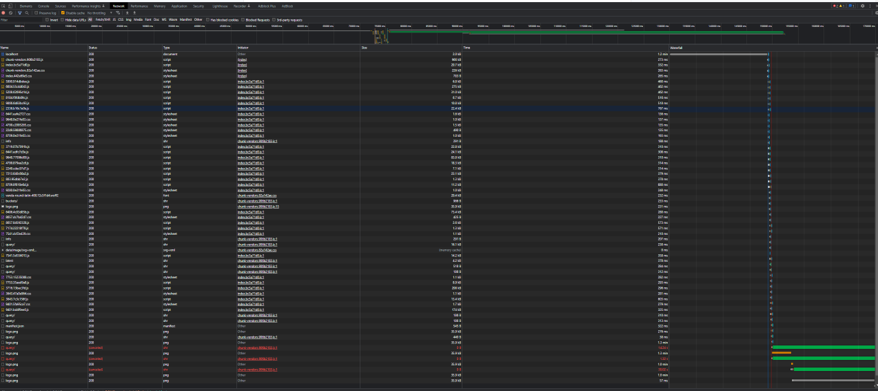
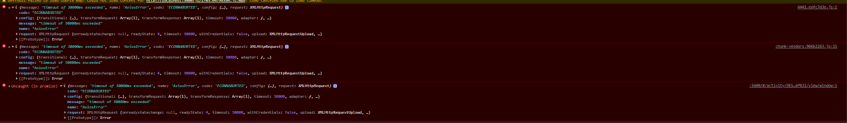
My brother just started using activity watch and it also took 1.2 minutes before becoming responsive. He is using version 0.12.1 in Chrome and on Windows 10.
The holdup appears to be the first request sent "localhost" which takes 1.2 minutes, following this all the javascript is loaded and page becomes reponsive. However the network tab is showing two "logo.png" requests taking 1.1 mins for server to respond and two "query/" requests failing after 30 seconds (see screen clips of network tab and console in chrome). Once cached further reloads have no issues.
Have the same issue.
Win 11 21H22 (Build 22000.1455)
Browser: Microsoft Edge Version 109.0.1518.49
Can confirm it has been like that right from the start, so even with a completely fresh and empty database.
It's fixed in the latest v0.12.2b1 release: https://github.com/ActivityWatch/activitywatch/releases/tag/v0.12.2b1
A proper v0.12.2 release will come as soon as people validate that the fix works without issues.