Request for some additional documentation
Hi!
I have completed the training step and now I have 10 .pkl files. Currently, I have two main questions and I really appreciate if answer them.
First question:
By using the below code (which was part of your source code), I could open that .pkl files. After checking the data variable, I saw that data[10001:] are all zero, which means that it didn't find any data from .pkl files to fill it. So, my question is that what parameters (options) in the training process specify the size of generated data (Number of generated output images)? For example, what should I do if I want more than 10000 generated data?
data = np.zeros((100000, 794))
dim = 0
import joblib
from tqdm import tqdm
for i in tqdm(range(1)):
    x =  joblib.load('/content/drive/MyDrive/datalens-personal/edit1/eps-0.25.data' + f'-{i}.pkl')
    data[dim: dim+len(x)] = x
    dim += len(x)
This is the code that I used for training:
python DataLens/main.py --data_dir <checkpoint_directory> \
 --shuffle --teachers_batch 10 --batch_teachers 1 \
--dataset fashion_mnist --max_eps 1 --train \
--nopretrain \
--nosave_epoch \
--epoch 300 \
--train_size 10000 \
Second question:
Could you please add some documentation about how to see the generated images? I know the output image is 28x28, so it has 784 columns. We add 10 additional columns for specifying the class of the image. However, my problem is with the actual value of data, which is all less than 1 for all indexes. I saw some functions in the utility.py, however, I am not sure how to use them. For example, by using the code below, I see this picture:
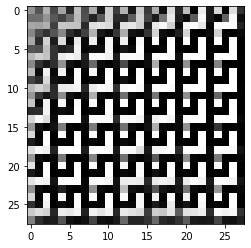
from matplotlib import pyplot as plt
for i in range(10):
  d = data[i, :-10]*256
  d = d.astype(np.uint16)
  plt.imshow(d.reshape(28, 28), cmap='gray')
  print(np.where(data[i, -10:] == 1))
  plt.show()
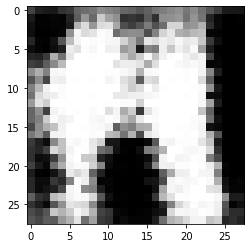
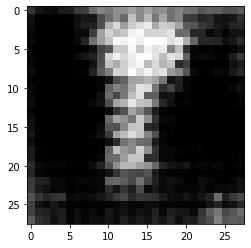
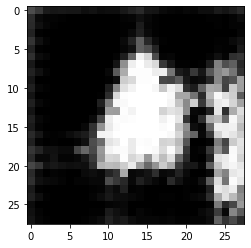
For other people who may have visualization problems, I used the exact same code that I previously mentioned. However, I changed the training parameters, and the problem is solved. I mean that if you are seeing meaningless images using that code, then you should reconsider the training parameters. In summary: By using this command for training:
python main.py --data_dir /home/fazlikh/DataLens/data --checkpoint_dir checkpoint3-1/ \
--topk 200 --signsgd --norandom_proj --shuffle  --teachers_batch 80 --batch_teachers 50 \
--dataset fashion_mnist --train --max_eps 1 --train --thresh 0.7 --sigma 5000 --nopretrain \
--z_dim 50 --nosave_epoch --epoch 100 --save_vote --d_step 2 --stochastic --max_grad 1e-5 --batch_size 30
And this code for visualization:
from matplotlib import pyplot as plt
for i in range(9000, 9010):
  d = data[i, :-10]*256
  d = d.astype(np.uint8)
  plt.imshow(d.reshape(28, 28), cmap='gray')
  print(np.where(data[i, -10:] == 1))
  plt.show()
You will get something like these images as output:
Thanks for your sharing. Did you use hyper-parameters from paper or by search?
Thanks for your sharing. Did you use hyper-parameters from paper or by search?
@TheSunWillRise You're welcome.
In the main documentation of this repository, there are some sections that show you which hyperparameters you should use. My biggest problem with those hyperparameters was batch_teachers and teachers_batch, which are large numbers like 50 and 80, respectively. These numbers require a lot of training time depending on the system that you are trying. However, they are safe to try, and you can be sure that you finally will receive some results.
However, my experience with MNIST and FMNIST dataset for max_epsilon = 10 using my own hyperparameters was a headache because by each epoch, the memory usage of the project will increase gradually (I am pretty sure this shouldn't happen) and you may need 200GB of RAM or even more in some cases. For example, I by using these parameters:
python main.py --checkpoint_dir fmnist_z_dim_50_topk_200_teacher_4000_sigma_5000_thresh_0.7_pt_30_d_step_2_stochastic_1e-5/ \
--topk 200 --signsgd --norandom_proj --shuffle  --teachers_batch 80 --batch_teachers 50 \
--dataset fashion_mnist --train --max_eps 1 --train --thresh 0.7 --sigma 5000 --nopretrain \
--z_dim 50 --nosave_epoch --epoch 300 --save_vote --d_step 2 --pretrain_teacher 10 --stochastic --max_grad 1e-5
and around 32GB of RAM, execution will be completed in almost 15 hours. But if I change only max_eps to 10, instead of 1, after almost 36 hours and 128GB of RAM, the memory limit exceeds, and the epsilon is not even close to 10. In summary, my challenge was memory usage, not training time.
I hope that I could answer your question.