Add eclair metrics grafana dashboard
In this is pull request I have added following:
-
eclair-metircs.jsonfile to monitor eclair host metrics on Grafana.
The JSON file contain fours rows with various panels. That helps users to monitor their eclair node metrics.

-
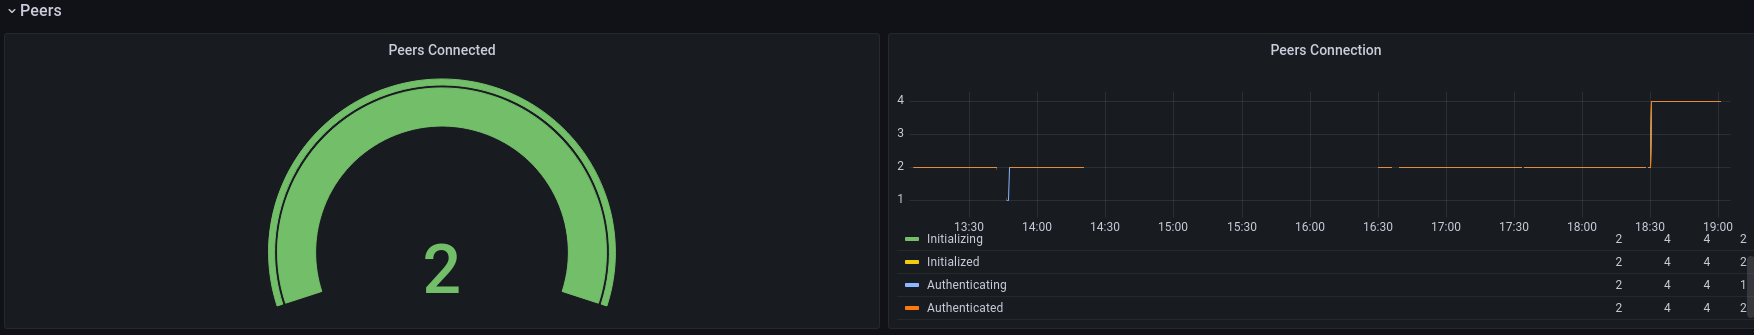
Peers (2 panels)
-
Channel (9 panels)
-
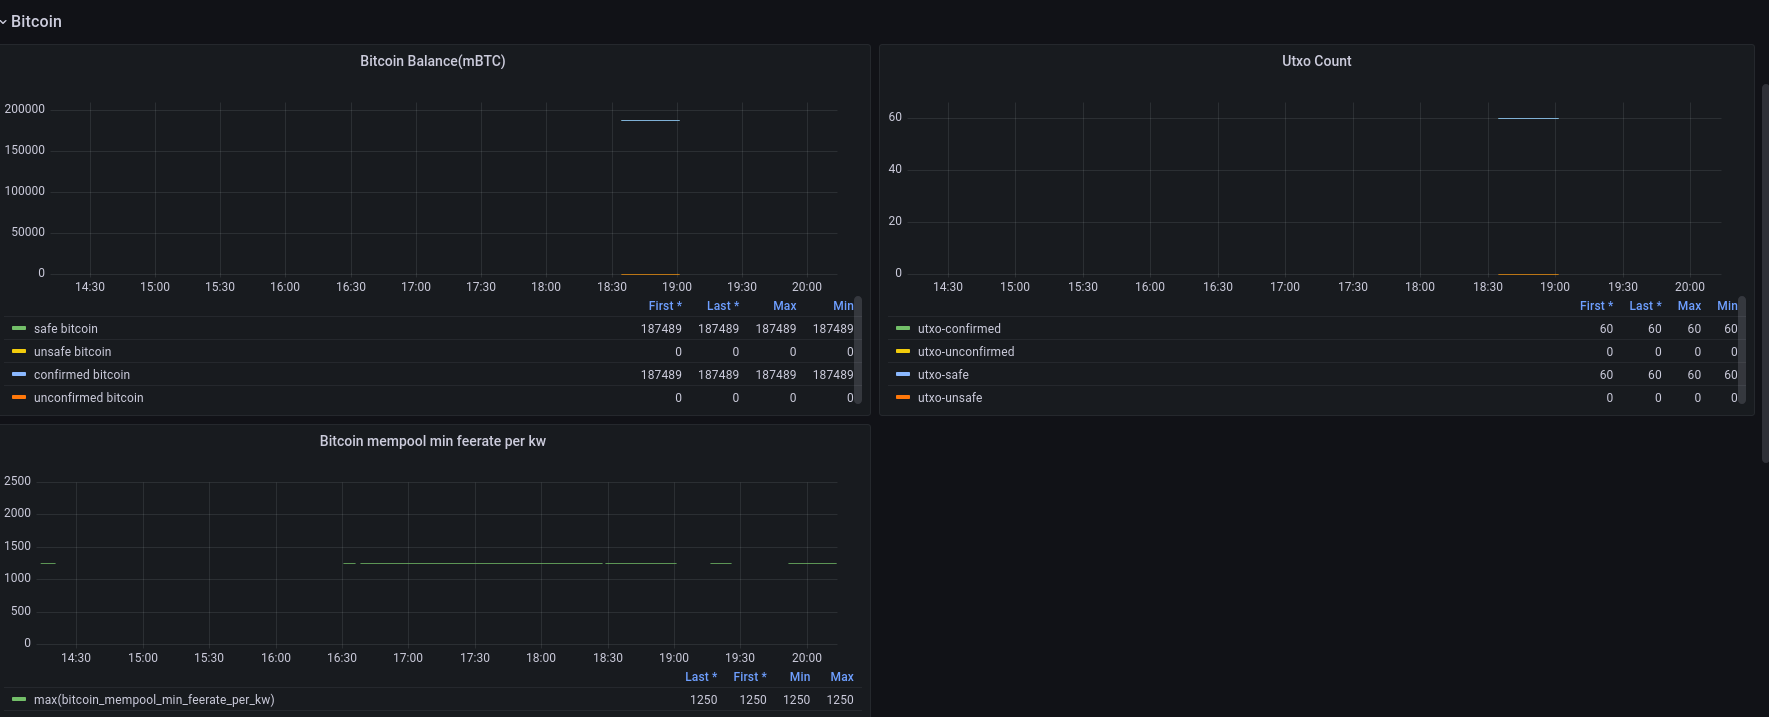
Bitcoin (3 panels)
Codecov Report
Merging #2343 (6f7b3d7) into master (e1dc358) will increase coverage by
0.13%. The diff coverage isn/a.
@@            Coverage Diff             @@
##           master    #2343      +/-   ##
==========================================
+ Coverage   84.68%   84.82%   +0.13%
==========================================
  Files         194      194
  Lines       14650    14671      +21
  Branches      613      604       -9
==========================================
+ Hits        12407    12444      +37
+ Misses       2243     2227      -16
| Impacted Files | Coverage Δ | |
|---|---|---|
| .../scala/fr/acinq/eclair/payment/PaymentPacket.scala | 73.03% <0.00%> (-18.28%) |
:arrow_down: |
| ...a/fr/acinq/eclair/wire/protocol/PaymentOnion.scala | 92.98% <0.00%> (-6.01%) |
:arrow_down: |
| .../fr/acinq/eclair/wire/protocol/RouteBlinding.scala | 96.00% <0.00%> (-4.00%) |
:arrow_down: |
| ...main/scala/fr/acinq/eclair/db/jdbc/JdbcUtils.scala | 88.23% <0.00%> (-2.95%) |
:arrow_down: |
| ...la/fr/acinq/eclair/channel/fsm/ErrorHandlers.scala | 80.39% <0.00%> (-1.25%) |
:arrow_down: |
| ...scala/fr/acinq/eclair/router/BalanceEstimate.scala | 98.91% <0.00%> (-1.09%) |
:arrow_down: |
| ...la/fr/acinq/eclair/wire/protocol/OfferCodecs.scala | 96.82% <0.00%> (-0.80%) |
:arrow_down: |
| ...r/acinq/eclair/payment/send/PaymentLifecycle.scala | 87.50% <0.00%> (-0.22%) |
:arrow_down: |
| ...clair/payment/send/MultiPartPaymentLifecycle.scala | 94.44% <0.00%> (-0.11%) |
:arrow_down: |
| ...a/fr/acinq/eclair/db/sqlite/SqlitePaymentsDb.scala | 99.45% <0.00%> (-0.07%) |
:arrow_down: |
| ... and 19 more |
Here is some feedback on the contents of each section.
Peers
The current panels aren't the best choice of things to monitor. We should instead provide the following two panels:
- a Gauge plotting
max(peers.connected) - a Time Series plotting
peerconnections.connectingfor each differentstateof that metric (authenticating,authenticated,initializing,initialized)
We don't need to monitor anything more at the peer level.
Bitcoin
You should have a single panel for the bitcoin.balance metric instead of having three separate ones (Global Bitcoin Balance, Confirmed/Unconfirmed Bitcoin and Safe/Unsafe Bitcoin). This single panel should display one line per status of the metric (safe, unsafe, confirmed, unconfirmed). Also, I don't think the unit is correct, I believe this is in mBTC, not BTC (but you should test it to verify).
The Bitcoin utxo panel should be renamed to Utxo Count and should also plot the safe and unsafe status.
You should remove the Onchain Confirmed/Unconfirmed Balance panel, it's redundant.
The bitcoin newblock checkconfirmed panel isn't useful either, you should remove it.
You should add a time series panel for the bitcoin.watchdog.blocks.skew metric, with one line per source.
Channels
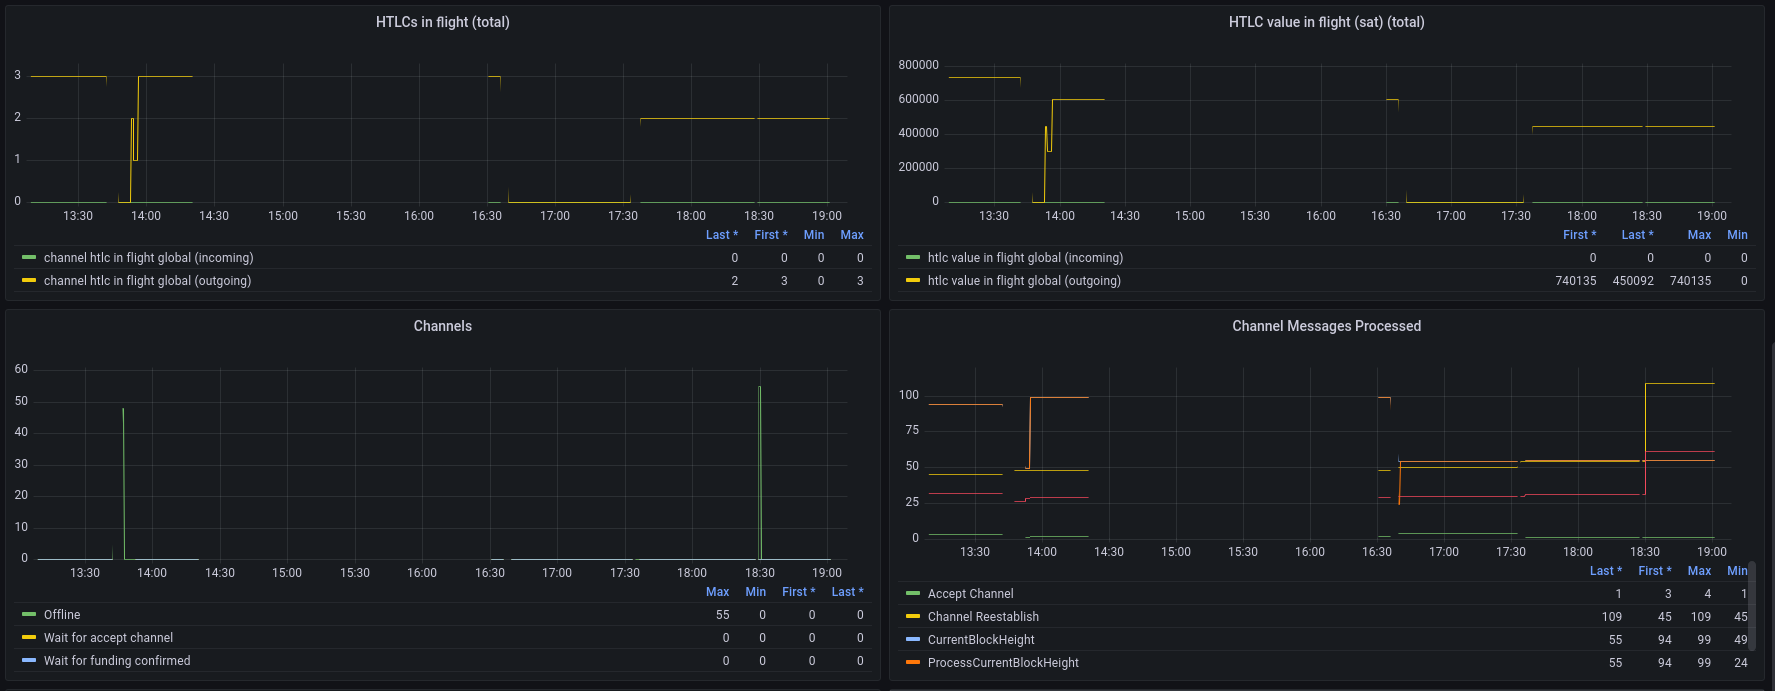
You shouldn't use gauges for the main Channels panel, this will create too many of them it's not a good way of displaying this information. You should simply use a time series, displaying one line for each state of the channels.count metric (NORMAL, OFFLINE, CLOSING, etc).
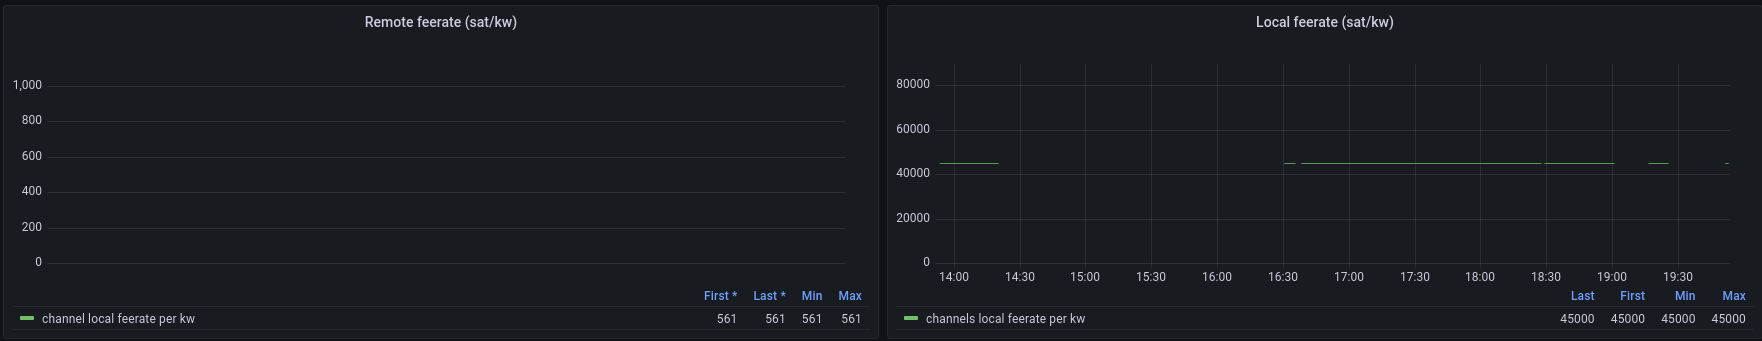
Why isn't the local feerate panel properly displaying a value? This looks like a bug, you should check that this panel is correctly configured. Also, it should be renamed Local feerate (sat/kw).
The Channel Messages Processed should display the time taken to process each MessageType, I don't think this is what you have currently done.
You should add a few more panels:
-
Remote feerate (sat/kw)-> a histogram plotting percentiles of thechannels.remote-feerate-per-kwmetric -
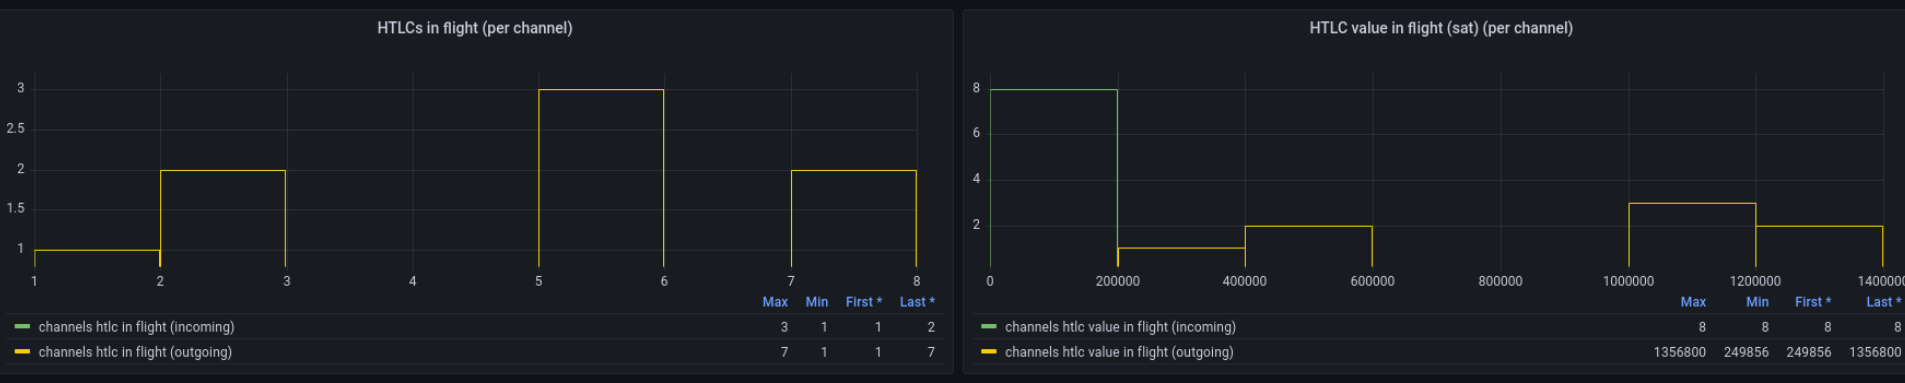
HTLCs in flight (per channel)-> a histogram plotting thechannels.htlc-in-flightmetric, for bothdirections (incomingandoutgoing) -
HTLC value in flight (sat) (per channel)-> a histogram plotting thechannels.htlc-value-in-flightmetric, for bothdirections (incomingandoutgoing) -
HTLCs in flight (total)-> a time series plotting thechannels.htlc-in-flight-globalmetric, for bothdirections (incomingandoutgoing) -
HTLC value in flight (sat) (total)-> a time series plotting thechannels.htlc-value-in-flight-globalmetric, for bothdirections (incomingandoutgoing)
Once all of those are added and fixed, this will be a good first start!
Misc
Please review yourself and fix typos, there are too many of them ("Channels local feerate per kq", "Unconfirmend Bitcoin", etc), it really doesn't look like serious work when there are such typos.
Also, make sure you understand the panels you are using and what aggregation you apply. You should spend time reading and understanding the Grafana documentation, in particular:
- https://grafana.com/docs/grafana/latest/basics/timeseries/
- https://grafana.com/docs/grafana/latest/basics/timeseries-dimensions/
- https://grafana.com/docs/grafana/latest/basics/intro-histograms/
Thanks mentor for providing feedbacks!
HTLCs in flight (per channel) -> a histogram plotting the channels.htlc-in-flight metric, for both directions (incoming and outgoing)
I have tried to generate metrics for HTLCs but didn't find well information to perform HTLC in eclair(LN). So decided to learn more about HTLCs and wrote an article on this topic and send it to adi for checking corrections and publishing on SoB blogs.
It will be great to me if we have some references for performing HTLCs in eclair.
We should instead provide the following two panels
Can we provide three panels peers connected, initialization and authentication to avoid intersections?
I believe this is in mBTC, not BTC (but you should test it to verify).
I too get bit confused about the unit, but I found the unit for global balance in eclair-cli doc
I have tried to generate metrics for HTLCs but didn't find well information to perform HTLC in eclair(LN). So decided to learn more about HTLCs and wrote an article on this topic and send it to adi for checking corrections and publishing on SoB blogs. It will be great to me if we have some references for performing HTLCs in eclair.
I think that you're confused about what HTLCs are.
HTLCs are the mechanism used to make lightning payments: any lightning payment creates HTLCs.
So you simply have to use the pay* APIs and HTLCs will be sent.
I wouldn't recommend writing yet another article about HTLCs, there are already plenty of them that are more accurate than yours...you can for example read https://ellemouton.com/posts/htlc-deep-dive/ and the other articles on that blog, they should help you understand lightning better.
Can we provide three panels peers connected, initialization and authentication to avoid intersections?
No, this isn't a good idea, it's useful to see them on the same graph to see the proportion between each case.
I too get bit confused about the unit, but I found the unit for global balance in eclair-cli doc
You shouldn't read the API doc to figure out details about metrics, that's really not how this works.
Whenever you want to add a graph for a metric, the first step you need to do is to locate that metric in the eclair code and read that code to see what the metric contains, otherwise the graph won't make any sense. You really need to do this for all the metrics you've included, we can't accept this PR if you don't understand each metric correctly. For example for the bitcoin.balance metric, if you had just searched for it in the codebase, you would have found that it's defined here, where we explicitly say it's in mBTC. Please spend enough time looking at the code for each metric, don't create graphs randomly by picking metrics in the list in prometheus/grafana.
Here is how you can keep HTLCs in channel (to visualize them in the corresponding metrics). You simply need to modify one line in MultiPartHandler.scala: https://github.com/ACINQ/eclair/blob/8a42246b18fa96c5fee3cc7f947884d06f9e9fea/eclair-core/src/main/scala/fr/acinq/eclair/payment/receive/MultiPartHandler.scala#L167
You should replace it with:
case p: MultiPartPaymentFSM.HtlcPart => log.warning(s"c:${p.htlc.channelId} hodling htlc #${p.htlc.id} instead of releasing preimage")
Recompile eclair with that change and run your nodes with that modified version of eclair. When you make payments, the payments will not complete and instead the HTLCs will stay in the channel and should be observable in the metrics.
You can also see them using the channels API, it has a field that contains the pending HTLCs.
Recompile eclair with that change and run your nodes with that modified version of eclair. When you make payments, the payments will not complete and instead the HTLCs will stay in the channel and should be observable in the metrics.
I replaced the line of code in MultiPartHandler.scala, recompile the eclair with new version. But it doesn't generate HTLCs metrics. I almost tried all the payments and channels commands including pending HTLCs list.
In parallel I drafted a channel dashboard with the help of metrics name in channel/Monitoring.scala. Here is link, If it find completely suitable we can simply add it to our eclair dashboard.
I replaced the line of code in MultiPartHandler.scala, recompile the eclair with new version. But it doesn't generate HTLCs metrics. I almost tried all the payments and channels commands including pending HTLCs list.
You must have done something wrong, it works on my machine. Can you push the branch with the change on your repo and send me the link? I'll verify that you applied the code change correctly.
Are you correctly seeing the new log line in your logs ("hodling htlc #
You must have done something wrong, it works on my machine. Can you push the branch with the change on your repo and send me the link? I'll verify that you applied the code change correctly.
Yes here is link to my repo.
Are you correctly seeing the new log line in your logs ("hodling htlc # instead of releasing preimage")? Can you share the logs of your test eclair nodes on https://paste.ec/ ?
Link to eclair.log file.
At the end problem at Actor also seems strange and node is not generating metrics for Actor!
Yes here is link to my repo.
The code change is correctly applied here.
Link to eclair.log file.
But the issue is that you haven't made any payment, so that's why you're not seeing any HTLC. Look at your logs, there's no trace of a single payment being made?
But the issue is that you haven't made any payment, so that's why you're not seeing any HTLC. Look at your logs, there's no trace of a single payment being made?
I have tried to make payments between my nodes but it seems little bit messy(loads of channels, etc) . So I setup new node and simple opens a new channel between them and follow create invoice, parse invoice and sendtonode. But maybe I did something wrong and it says route cannot found.
my eclair.log file.
The process should be quite straight-forward, you only need to use the APIs listed in our basic documentation: https://github.com/ACINQ/eclair/blob/master/docs/Usage.md
Why do you use sendtonode for example? You should just use payinvoice.
The setup should be very simple:
- launch two eclair nodes A and B
- open a channel between A and B
- create an invoice from B
- pay that invoice from A
- re-do that a couple time, sometimes in the other direction, to make sure there are HTLCs in both directions in that channel
You can find more samples in the repository I shared with you earlier: https://github.com/t-bast/lightning-cfg/blob/master/.eclair/setup_channels.sh
You can find more samples in the repository I shared with you earlier: https://github.com/t-bast/lightning-cfg/blob/master/.eclair/setup_channels.sh
I simply followed the steps:
- Start node A and B
- Connect node A and B(using node id of B)
- Opens a channels with some fundingSatoshis and nodeId
- Created invoice from node B with the help of description and amountMsat.
- And finally pay that invoice from node A and include --invoice=serialized
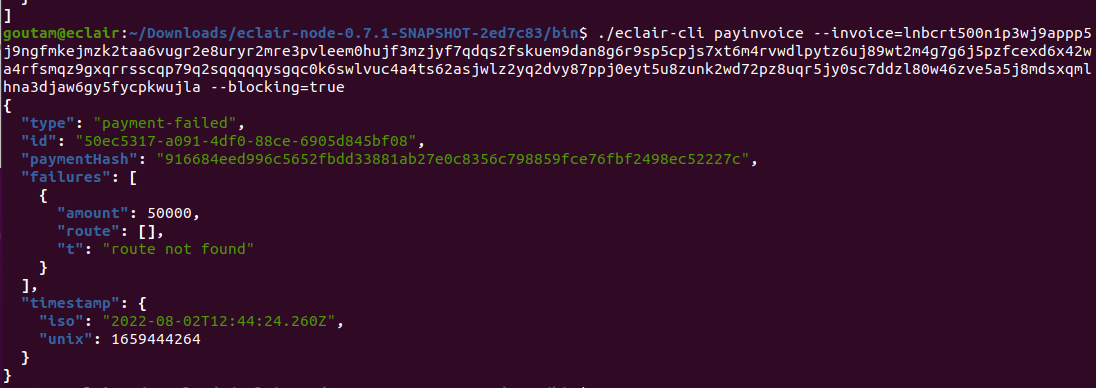
This time I tried payinvoice also but it renders the same issue route not found. Even opened a two new channels.
Could we arrange a short mins meet if possible?
Have you looked at the logs? The most efficient way to debug this is if you send me exactly the commands that you ran and the logs of the two nodes.
Quick idea: are you sure you generated blocks to make the funding transaction confirm? If you didn't that's why the payments fail, but I'm surprised you've never done it before, you were supposed to learn how to use lightning nodes by following the scripts from the sample repository I sent you a long time ago (https://github.com/t-bast/lightning-cfg).
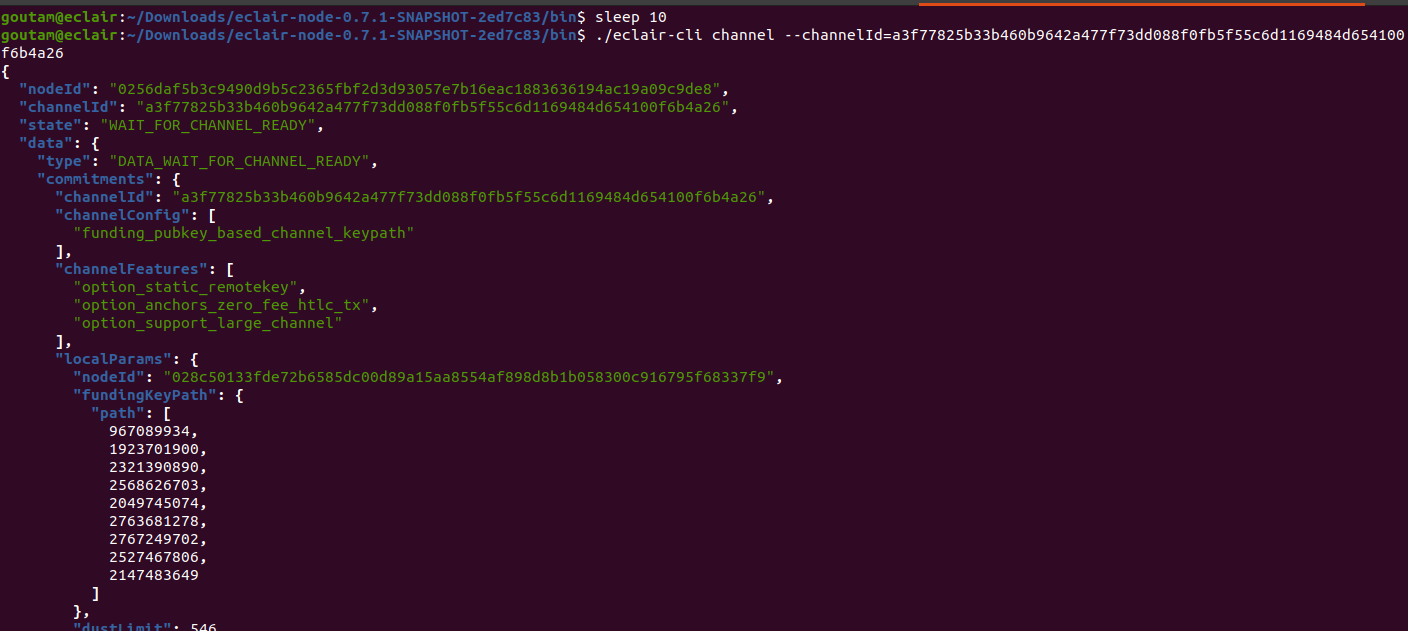
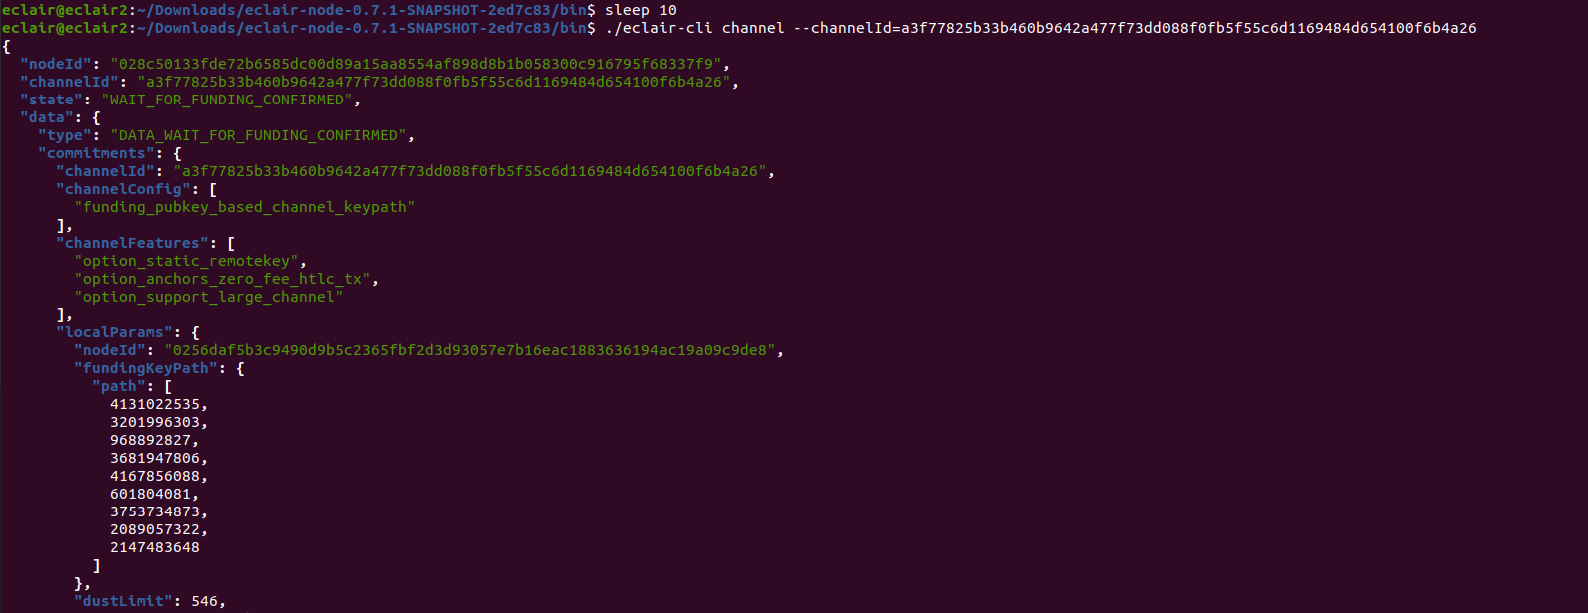
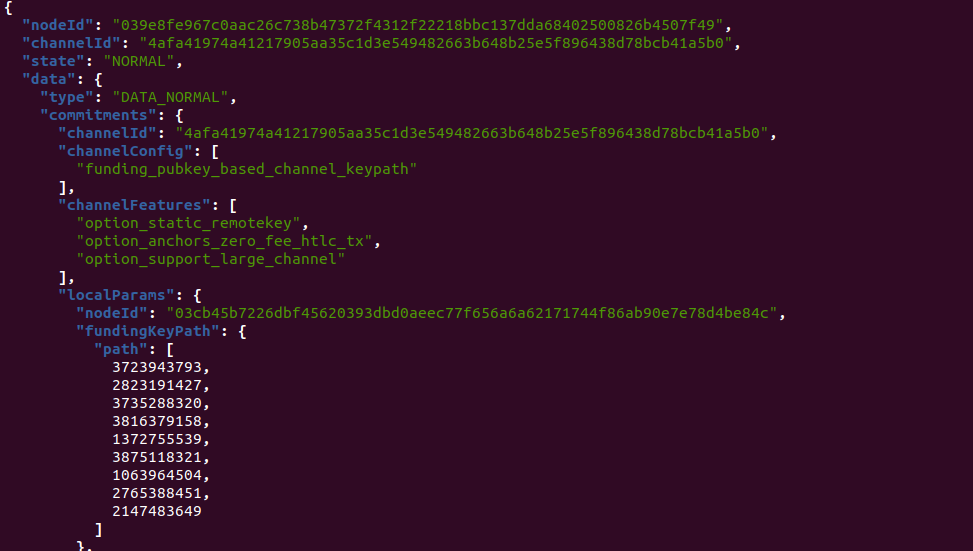
If you call the channels API it will tell you the state of the channel, it should be in state NORMAL before you can make payments. If it's in state WAIT_FOR_FUNDING_CONFIRMED, then you didn't correctly follow all the steps.
To generate blocks, just look at what is done here: https://github.com/t-bast/lightning-cfg/blob/b84b63702ec60d5dac530982e86f6df6574092a1/.eclair/setup_channels.sh#L40
Have you looked at the logs? The most efficient way to debug this is if you send me exactly the commands that you ran and the logs of the two nodes.
yes I have performed below mentioned commands.
At Node A.
- Connect to B using nodeId(B).
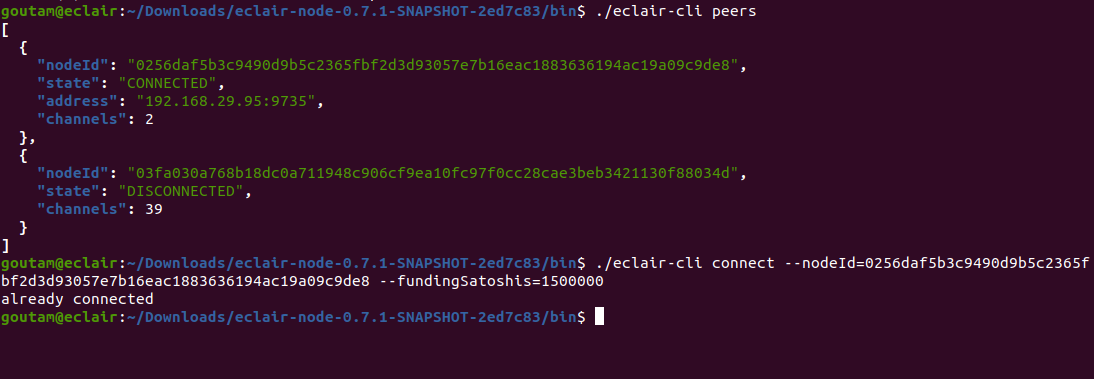
- Open channel at node A

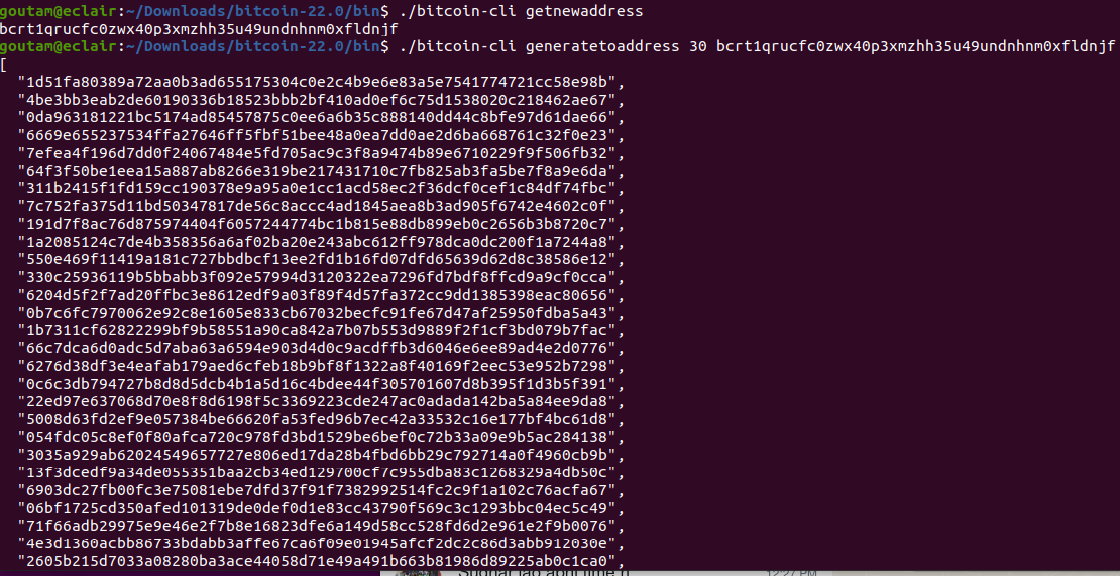
- generatetoaddress at node A.
- Check channel status at Node A.
At Node B
- Channel status at node B.
Both node A and B have sufficient balances to open channels and make payments.
Logs
As the channels command tells you, the channels are not ready.
It's most likely that you created blocks with generatetoaddress too quickly (before the funding transaction was broadcast).
You should wait for the funding transaction to be in the mempool before generating blocks, otherwise it's useless.
You can use bitcoin-cli getrawmempool to verify that the funding transaction is in the mempool before generating blocks.
That's why the scripts I sent you contain a sleep command before calling generatetoaddress.
As the
channelscommand tells you, the channels are not ready. It's most likely that you created blocks withgeneratetoaddresstoo quickly (before the funding transaction was broadcast). You should wait for the funding transaction to be in the mempool before generating blocks, otherwise it's useless. You can usebitcoin-cli getrawmempoolto verify that the funding transaction is in the mempool before generating blocks. That's why the scripts I sent you contain asleepcommand before callinggeneratetoaddress.
Sorry for asking again and again.
I have used getrawmempool but it returns null [] and I also wait for a while after creating a channel and generating BTC even used sleep command.
I really wanna get rid of this mistake!
I see this line in your logs:
2022-08-02 19:34:12,500 INFO f.a.e.c.p.MempoolTxMonitor n:03fa030a768b18dc0a711948c906cf9ea10fc97f0cc28cae3beb3421130f88034d c:cee157f3237087c6bfb8426ff4d027ab0b8f0c11d7f54ec52ae3cea5dbb114e7 t:117529ca - could not publish tx: one of our inputs cannot be found
I don't know what you did wrong, but clearly your lightning node setup is completely broken... Please just follow what is done in this simple repository: https://github.com/t-bast/lightning-cfg Everyone who used it was able to run lightning nodes without issues, I don't see why it wouldn't work for you as well.
Don't run commands blindly, you should really take the time necessary to understand them and what activity they generate (read the logs whenever you run a command, that's the only way you'll see what actually happens!).
Don't run commands blindly, you should really take the time necessary to understand them and what activity they generate (read the logs whenever you run a command, that's the only way you'll see what actually happens!).
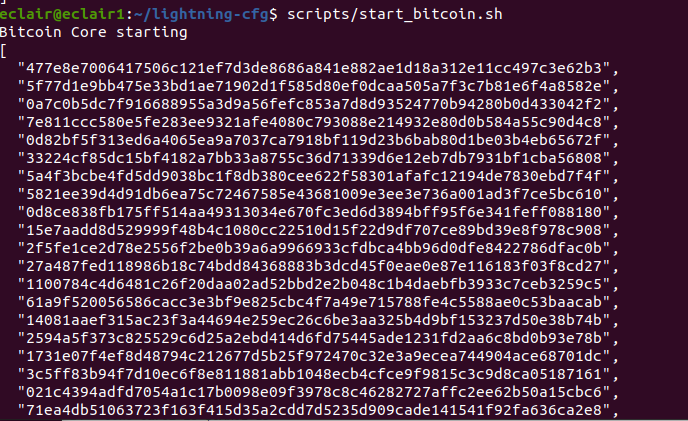
I am using scripts send by you and as the outcomes start_bitcoin.sh working completely fine at my end. And returns outputs
After that I ran .eclair/setup_channels.sh and it shows
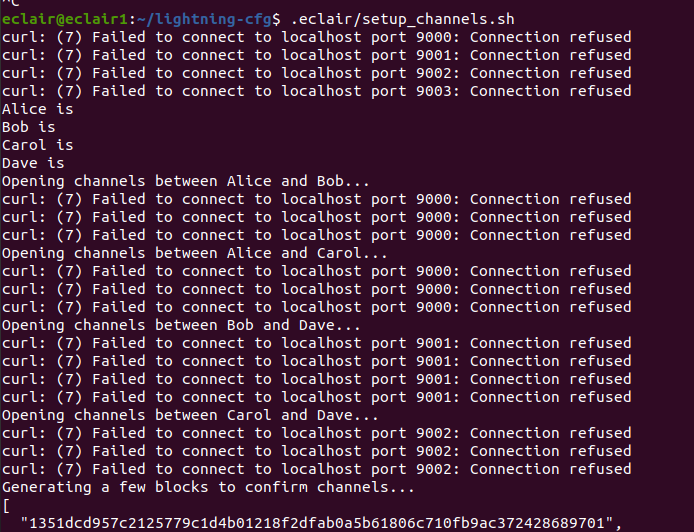
Note: While running this scripts I put my eclair-node and bitcoin core off.
Probably this issues are rising because alice, bob, carol and dave nodes are not running, Did I need to make any tweaks at my end?
Don't run commands blindly, you should really take the time necessary to understand them and what activity they generate (read the logs whenever you run a command, that's the only way you'll see what actually happens!).
Finally the great news comes!!!!!!!😀
All the channels are in normal states and am moving ahead with further implementation.
Sorry for disturbing again and again, But this conversation really helped a lot to me.
All the channels are in normal states and am moving ahead with further implementation.
Good to know, let me know when this is ready to review. When it is, please provide new screenshots of all the panels in action.
You should add a time series panel for the bitcoin.watchdog.blocks.skew metric, with one line per source.
I am not able to see watchdog in the metrics list and don't know what actually watchdog is...
I am not able to see watchdog in the metrics list and don't know what actually watchdog is...
Then just ignore it for now, we need to make progress on this PR, I'll add watchdogs later.
Same as #2347, let's merge this as-is, we can always improve it later. I strongly encourage node operators who want to experiment with these new monitoring dashboards to challenge the values they see and contribute back by enriching the graphs or fixing what may be incorrect.