AAChartCore
 AAChartCore copied to clipboard
📈📊☕️☕️☕️An elegant modern declarative data visualization chart framework for Android. Extremely powerful, supports line, spline, area, areaspline, column, bar, pie, scatter, angular gauges, arear...
这是目前我使用该项目做出的效果 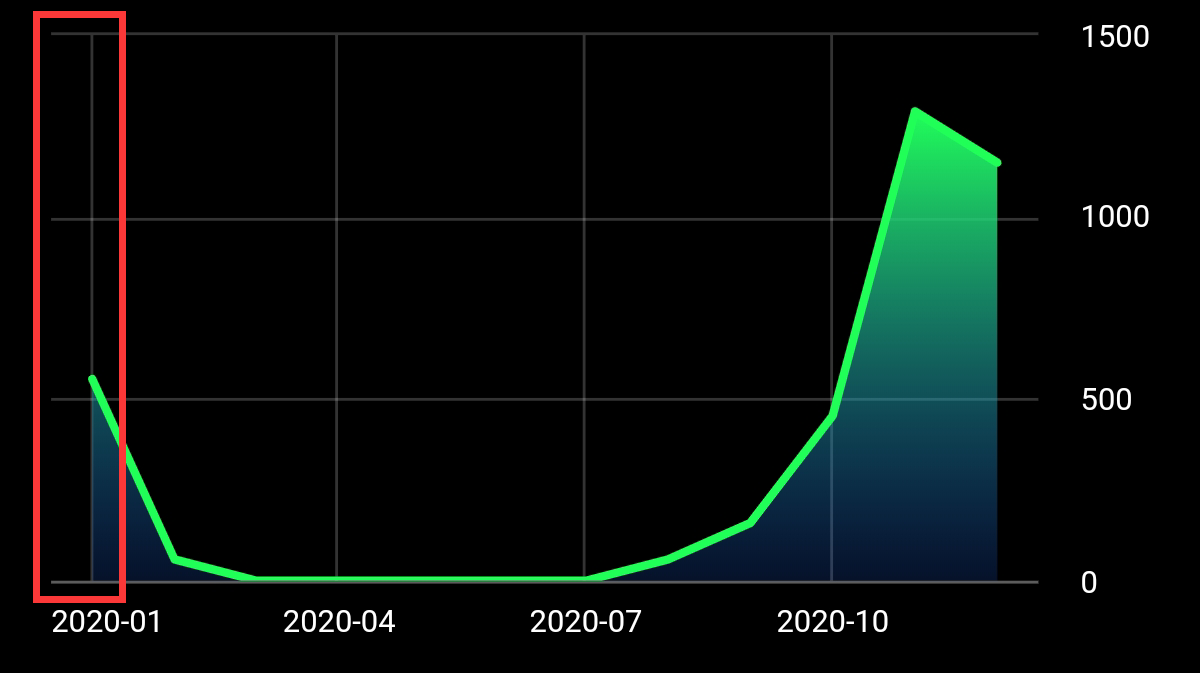 这是想要达到的理想效果 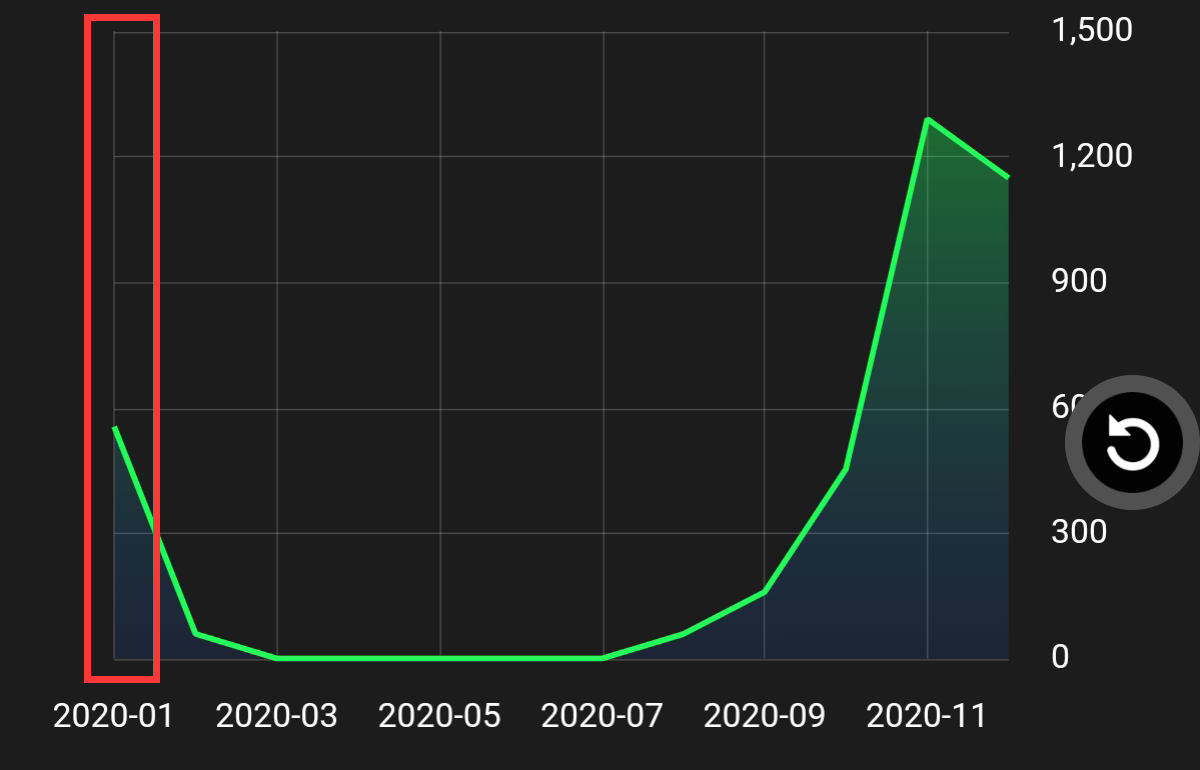 请问能否使折线图中的轴线从第一个网格线处开始? 或者能否自定义X轴数据类型为String,从而避免设置category以达到相同效果?

您好,关于AAPlotLinesForChart标注文章位置问题怎么设置,在例子里面只找到设置它y轴偏移量的方法,但是我现在的业务场景需要将它设置在坐标轴最右侧。希望您能帮忙解答一下.
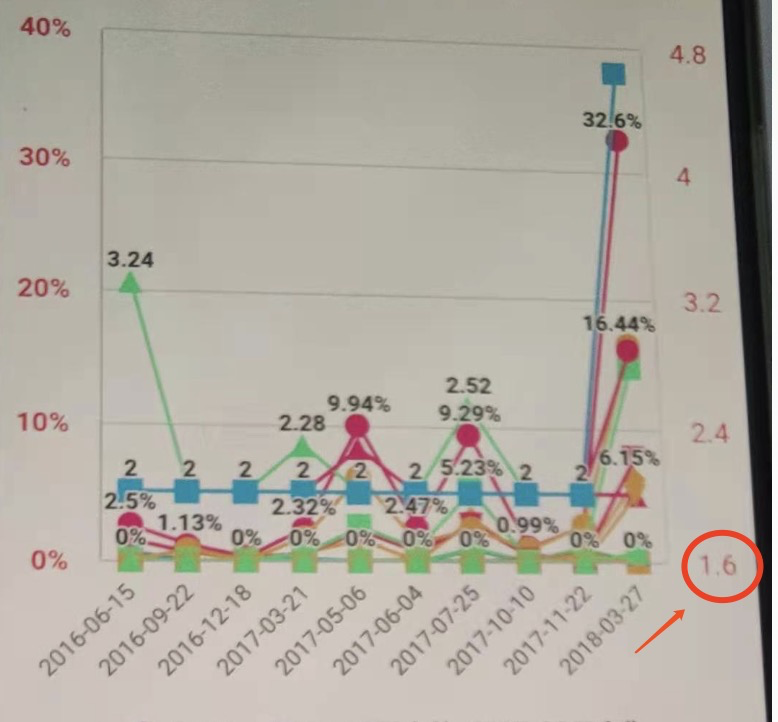
在值较小的时候,比如200以下,yaxis.max()基本可以正常工作,但是一旦数值偏大,最终y轴的实际最大值就会与yaxis.max()函数里设置的期望值出现很大偏差
Caused by: java.lang.ClassNotFoundException: Didn't find class "android.webkit.RenderProcessGoneDetail" on path: DexPathList[[zip file "/system/app/WebViewGoogle/WebViewGoogle.apk"],nativeLibraryDirectories=[/system/app/WebViewGoogle/lib/arm64, /system/app/WebViewGoogle/WebViewGoogle.apk!/lib/arm64-v8a, /system/lib64, /vendor/lib64, /system/lib64, /vendor/lib64]] Caused by: java.lang.ClassNotFoundException: Didn't find class "android.webkit.SafeBrowsingResponse" on path: DexPathList[[zip file "/system/app/WebViewGoogle/WebViewGoogle.apk"],nativeLibraryDirectories=[/system/app/WebViewGoogle/lib/arm64, /system/app/WebViewGoogle/WebViewGoogle.apk!/lib/arm64-v8a,...
Metadata
Owner
Metadata
📈📊☕️☕️☕️An elegant modern declarative data visualization chart framework for Android. Extremely powerful, supports line, spline, area, areaspline, column, bar, pie, scatter, angular gauges, arear...